
Financial Accounting Platform
A complete financial accounting platform built with open-source software.

Rails
Forest Admin
Metabase
Background
I've always wanted to get a better handle on my finances, but the existing consumer apps left a lot to be desired. I had tried using Mint, and while it was a good start, it didn't have many of the features I considered essential, so I stopped using it.
However, I knew that I could build a better system for myself with the right tools. Below, I outline the problems I wanted to solve and how I did it.
Step 1: Data Aggregation
I first needed to get all my transaction data in a database. Plaid is an API product that enables users to pull their financial data, but it's quite expensive.
Since Mint had all my data already, I decided to build a web scraper that would pull all my financial data from Mint.
This proved to be pretty gnarly by itself. I set up a headless Chrome browser that would log in to Mint, iterate through all transaction pages, and save them in a database. Mint sometimes requires 2FA. When the scraper detects that Mint is waiting for a 2FA token, it texts me that a token was requested. I can reply to that text message with the token that was sent to me, and the system will enter it on my behalf. Pretty cool!
Step 2: Admin Tools
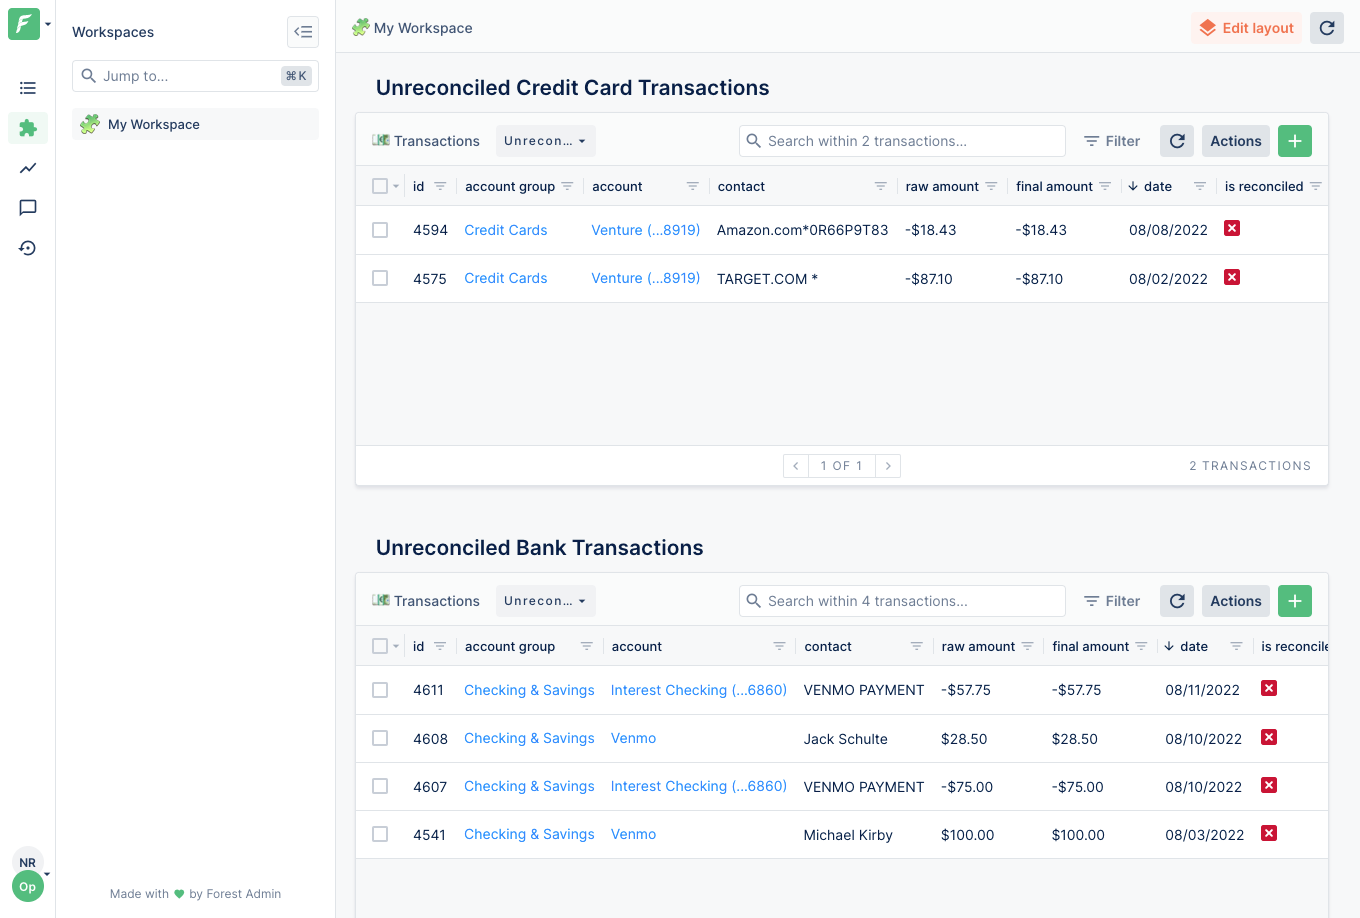
The real fun could begin now that I had my raw financial data. The following are the key features I added for data administration using Forest Admin:
Reconciliation
By default, all transactions are born as "unreconciled". This means that transaction has not been "approved" in an accounting sense. Therefore, these transactions are visible on my central dashboards. You can reconcile transactions so that they disappear from your dashboards. This is a standard feature in all business accounting tools.
Transfers
What happens if I pay $500 for a group dinner on my credit card and then receive $400 in Venmo reimbursements? My credit card bill is now inflated by $400, and it also looks like I made $400 in income from Venmo. To solve this, I created Transfers. In the aforementioned case, you can transfer the $400 from Venmo to the $500 credit card bill. Now the credit card transaction appears as if it was only $100, and there are no more Venmo transactions. This is the actual state of the world - I only paid $100 on my credit card for dinner! This is super useful once we start graphing this data (more on this later).
Automatic Inverse Transaction Detection
Imagine my bank pays off my credit card bill of $1,000. I'll see a +$1,000 transaction in my credit card statement and a -$1,000 transaction in my bank statement. If I were to accept these transactions as accurate, they would inflate both my spending and income graphs. In these cases, the system automatically detects two equal but opposite transactions and suggests you join them together to become $0. No more graph inflation!
Tagging
Tagging is super useful. As an example, I built this shortly before moving to Brooklyn. I started spending lots of money on new furniture and wanted to stay on top of my expenditures. Every time I saw a transaction for a furniture purchase, I would add a "Home Improvement" tag to the transaction. Once I added graphing, I could easily see how much money was spent on various groups of expenditures.
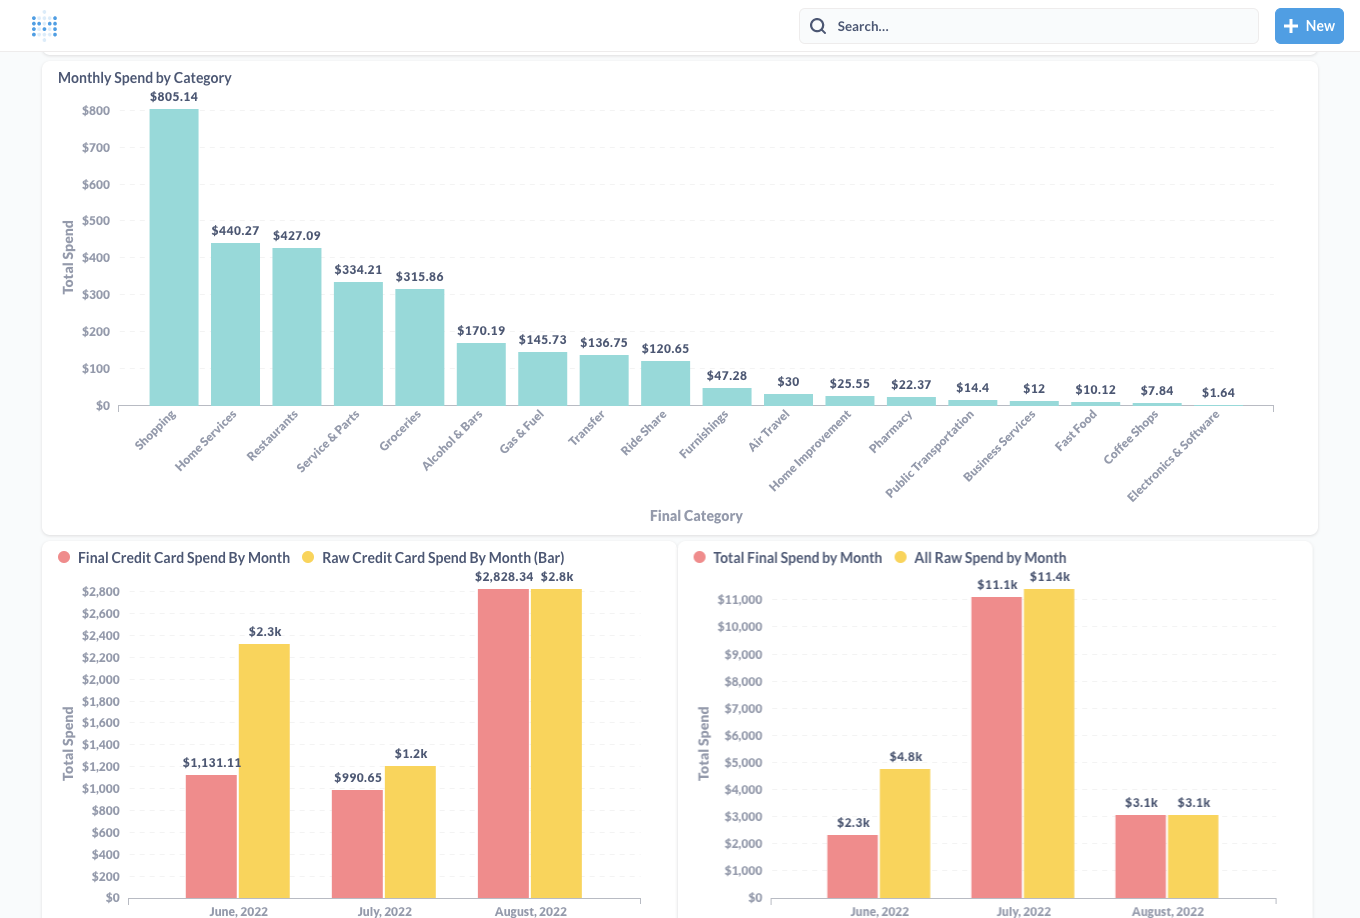
Step 3: Graphing
As you've seen, many of the admin features I added were so that I could have good data for graphing. Using Metabase, I created a suite of analytics dashboards where I could easily see the following data:
- My monthly credit card spend broken down by category (e.g., shopping vs. food).
- My most expensive credit card transactions of the month.
- My total credit card bill vs. actual credit card bill when deducting reimbursements.
- My monthly savings.
- My monthly expenditures on my move to Brooklyn.
The best part is that I can add any graph I want in the future!
© 2022 Codemang